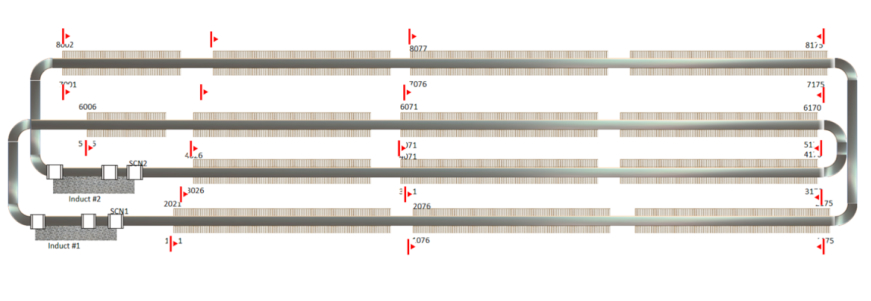
Bin Full Monitor
Pitney Bowes
Overview
The "Bin Full Monitors" are one solution to a three-pronged problem. Sorting equipment was not being emptied fast enough. Bins were getting clogged up, which slowed down package deliveries. The addition of monitors would provide better visibility to the workers emptying the bins.
Results
- Reduced average bin full time by over 50%
- Significant reduction in re-running parcels
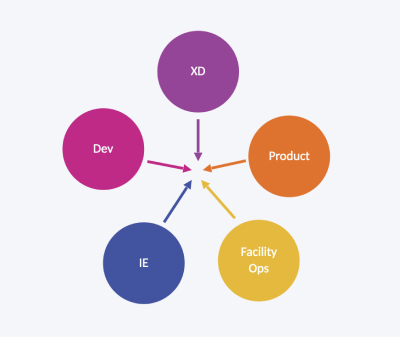
The Workshop
Representatives from 5 different groups met in a facility to resolve the “bin full” issue some package sorting equipment was experiencing. Teams representing product, facility operations, industrial engineering, development, and experience design collaborated to rapidly iterate on a solution.
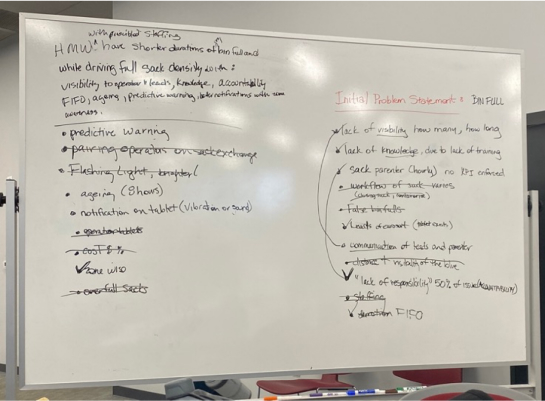
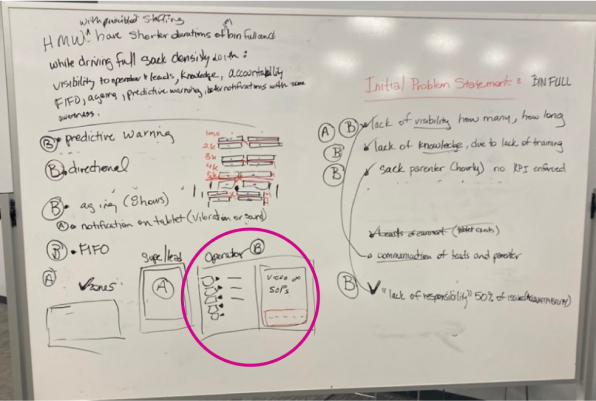
Step 1 - Defining the Problem
Each team member broke down the problems around bin fulls from their perspective. We then synthesized the list of problems into an initial problem statement.
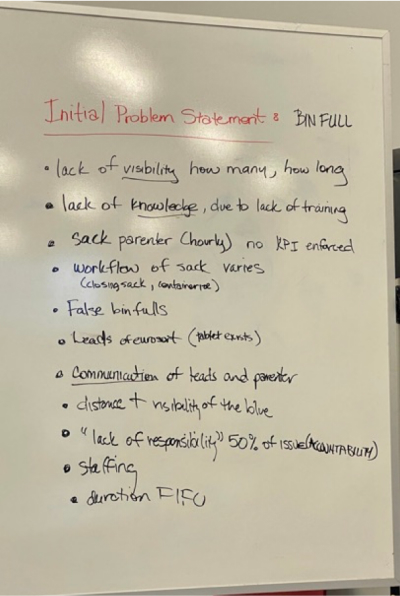
Initial Problem Statement
“How might we with prescribed staffing, have shorter durations of bin full while driving full sack density with: visibility to operators and leads, knowledge, accountability, FIFO, ageing, predictive warning, better notifications with zone awareness.”
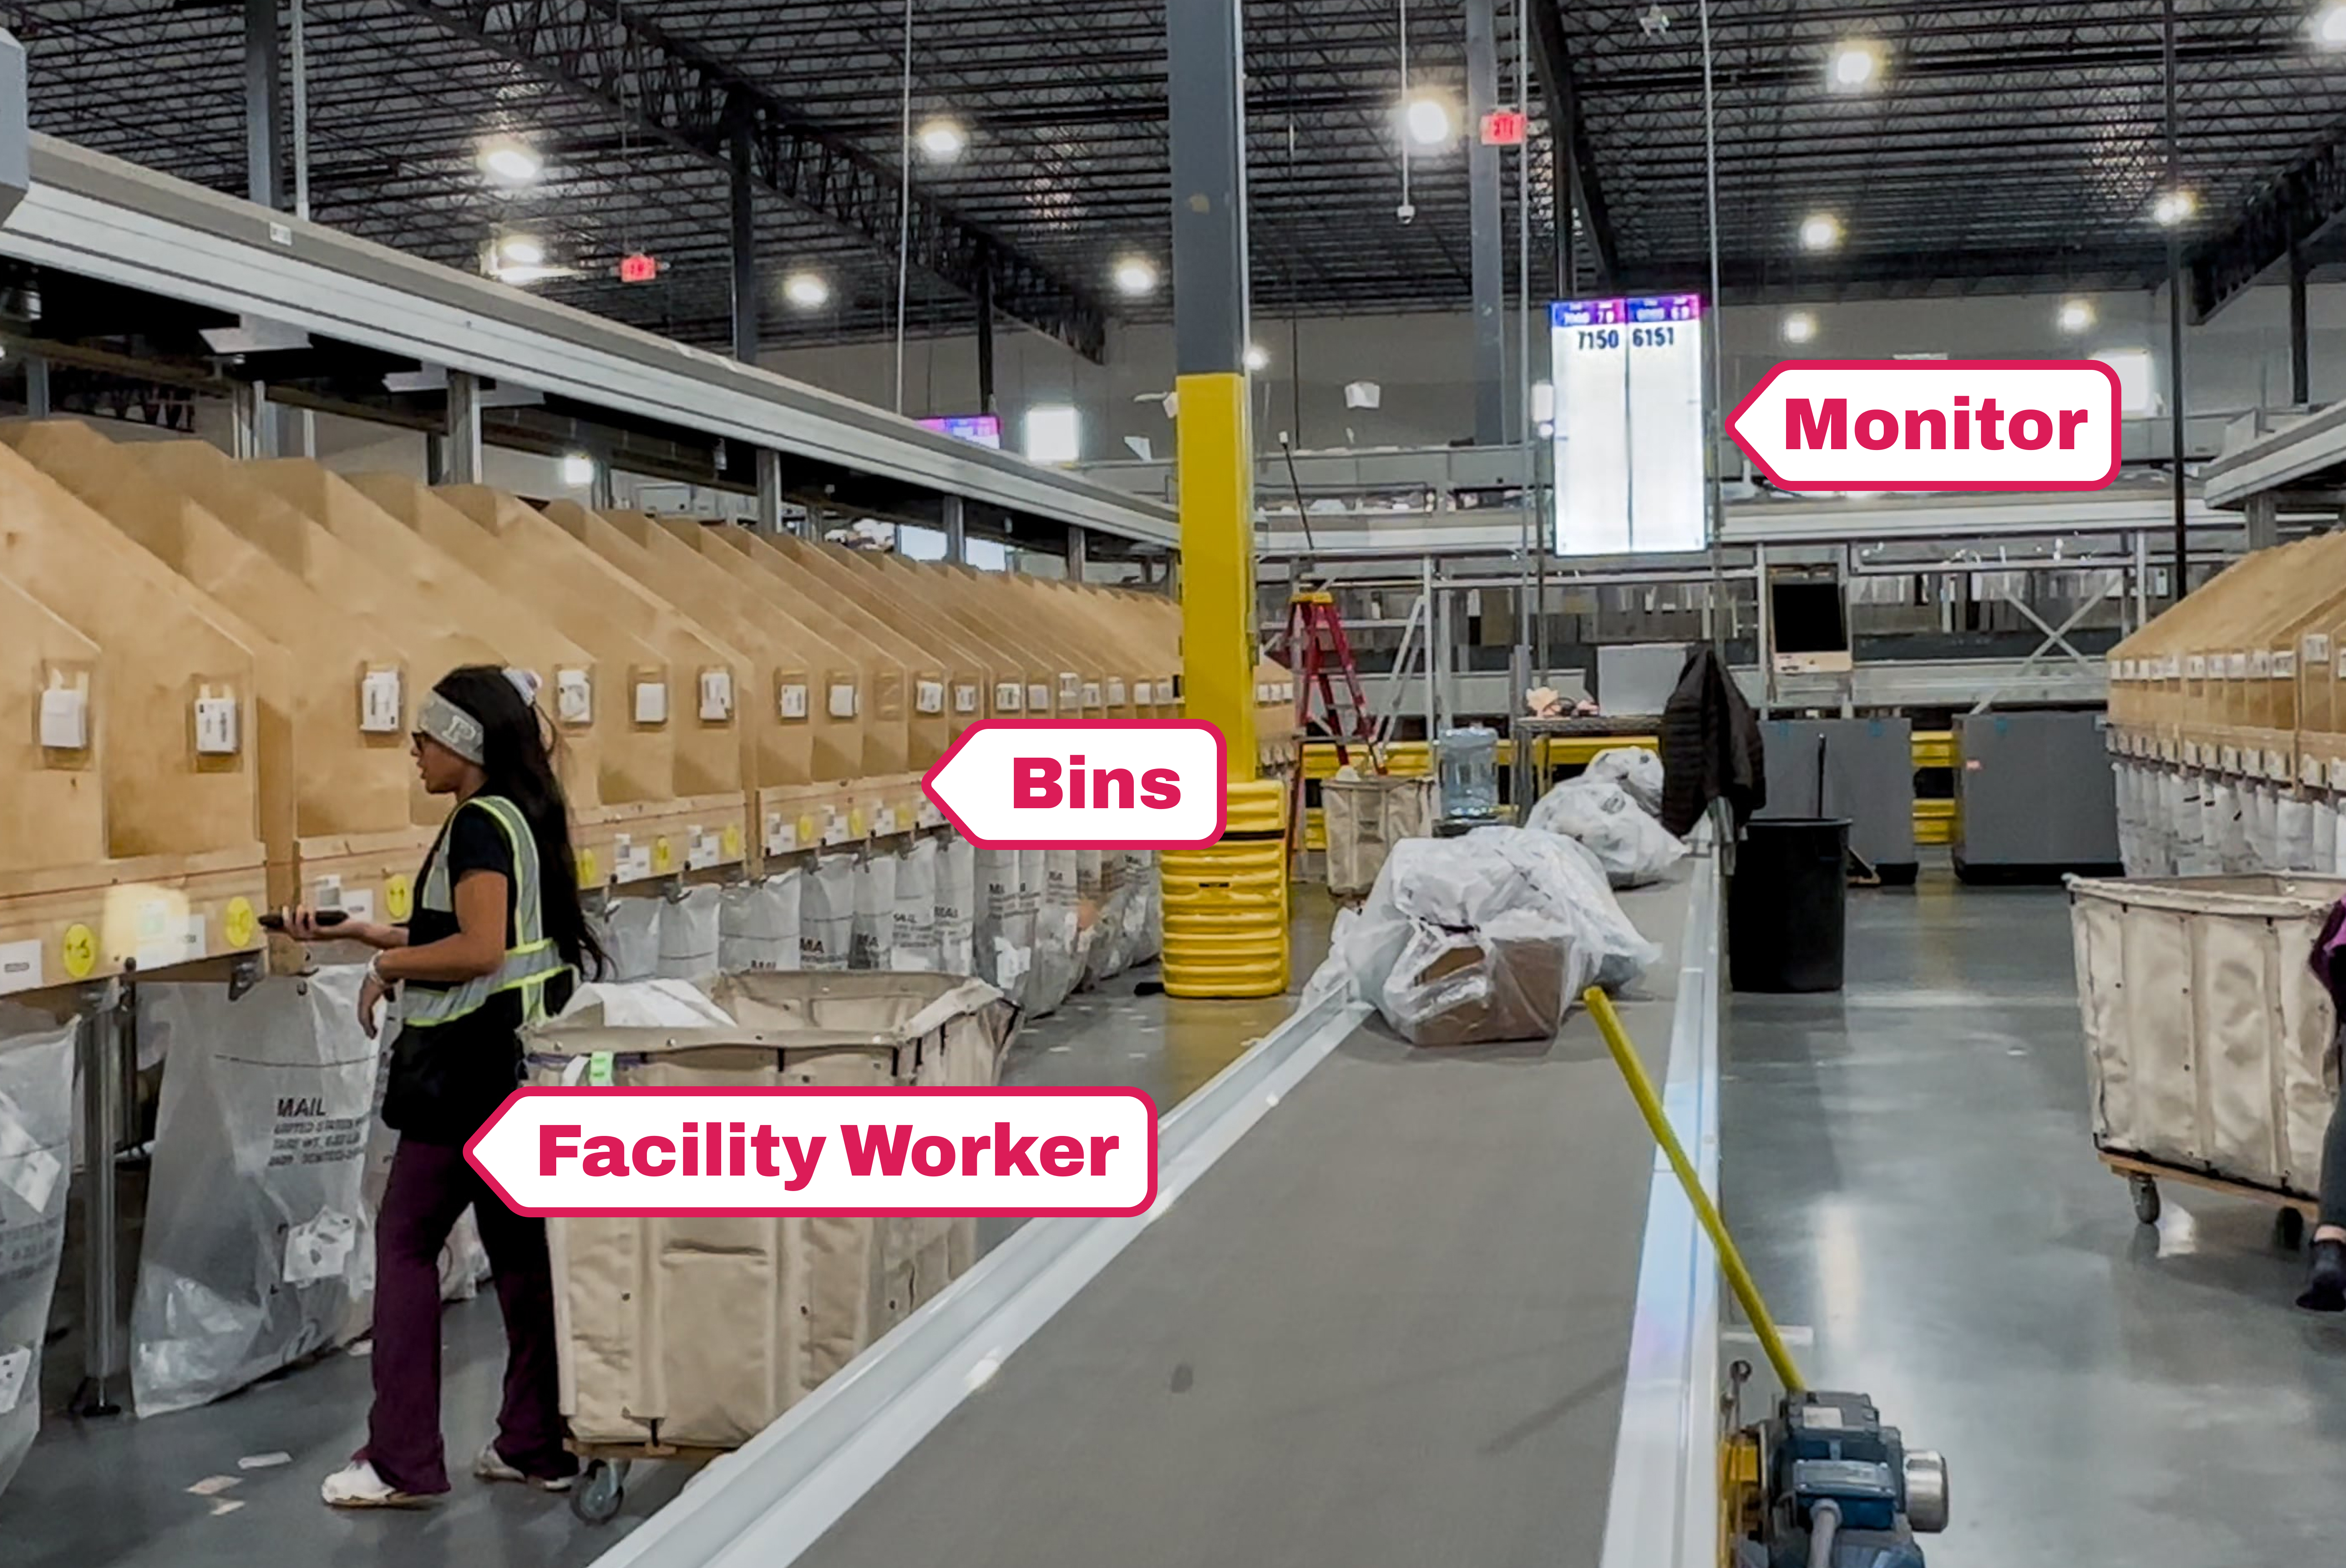
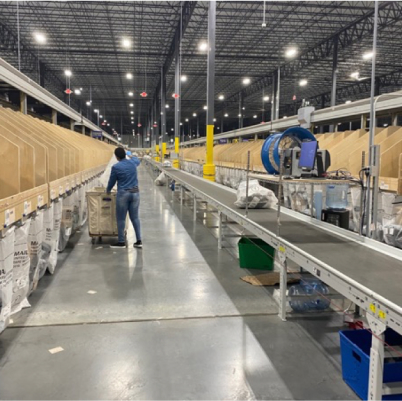
Step 2 - Observation
The team went to the facility floor to observe the workers' interaction with bin fulls. We interviewed the workers on the bin full alert, replacing the sack, and their perspective of issues around bin full delays.
Two Problems Emerged:
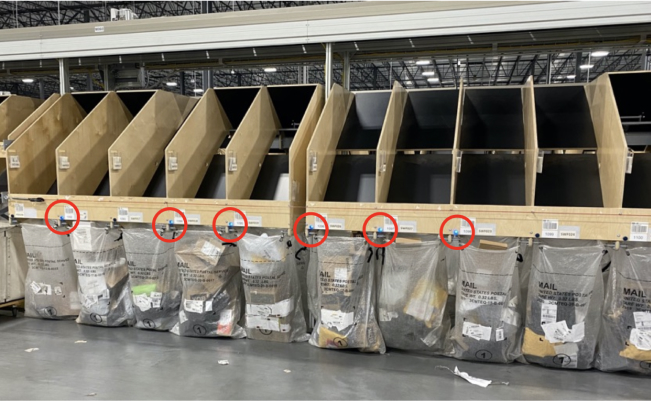
- The small blue lights meant to indicate a full bin were too small and dim to users to see from a distance.
- Users had no idea how long a bin was full so they could not prioritize the bins that were full the longest.
Step 3 - Refining the Problem
After the visit to the facility floor we regrouped to refine our problem statement and narrow down the scope.
Refined Problem Statement
“How might we help operator and leads with visibility, knowledge, communication and process for more accountability around bin fulls on the facility floor.”
Step 4 - Ideation
Using a design thinking technique called “Round Robin," each team member drew or wrote a solution using features we had discussed. We passed each design around to critique and refine then voted on the strongest concepts.
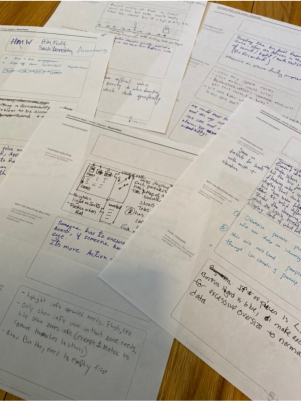
Step 5 - Breaking down the problems by Persona
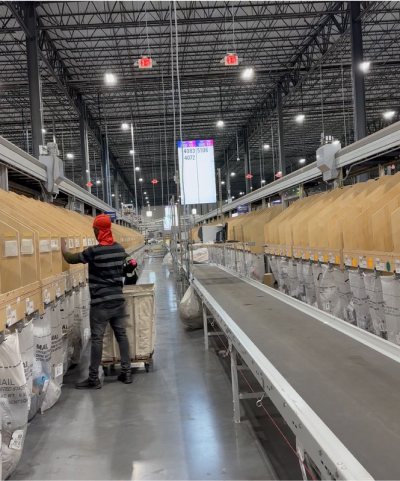
We realized some features were only necessary for certain personas, so we created solutions for each persona. The first persona we addressed was the operator. These are the people responsible for walking around the equipment, emptying bins and replacing sacks that are full of packages. One of the metrics they are graded on is average bin full time. To make the process more efficient, we created a monitor display to enhance the user's visibility.
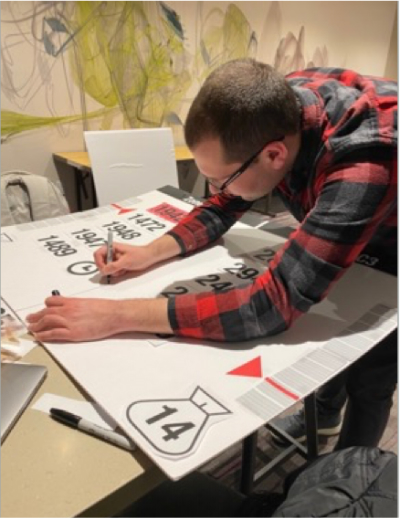
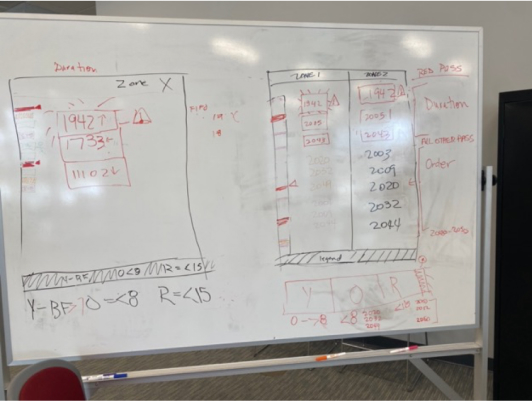
Step 6 - Prototype
Overnight, my supervisor and I created a full-sized mockup. The next morning we brought it back to the facility to visualize in place and get feedback from operators.
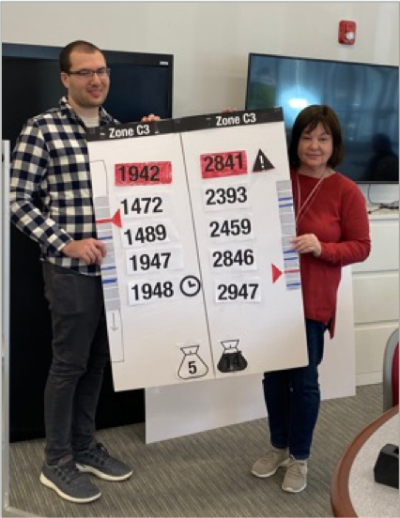
Based on feedback from the team and discussions with users, we iterated the prototype, adjusted visuals, added animations and defined thresholds for escalating bin full alerts.
Step 7 - Final Design and Development
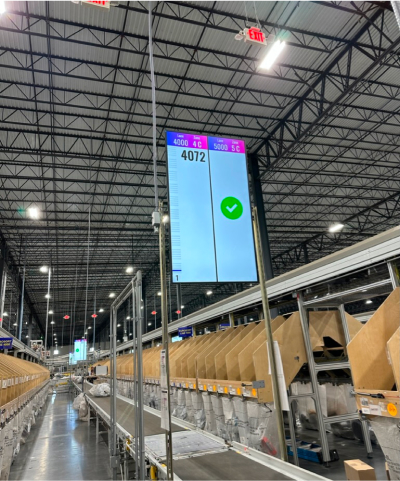
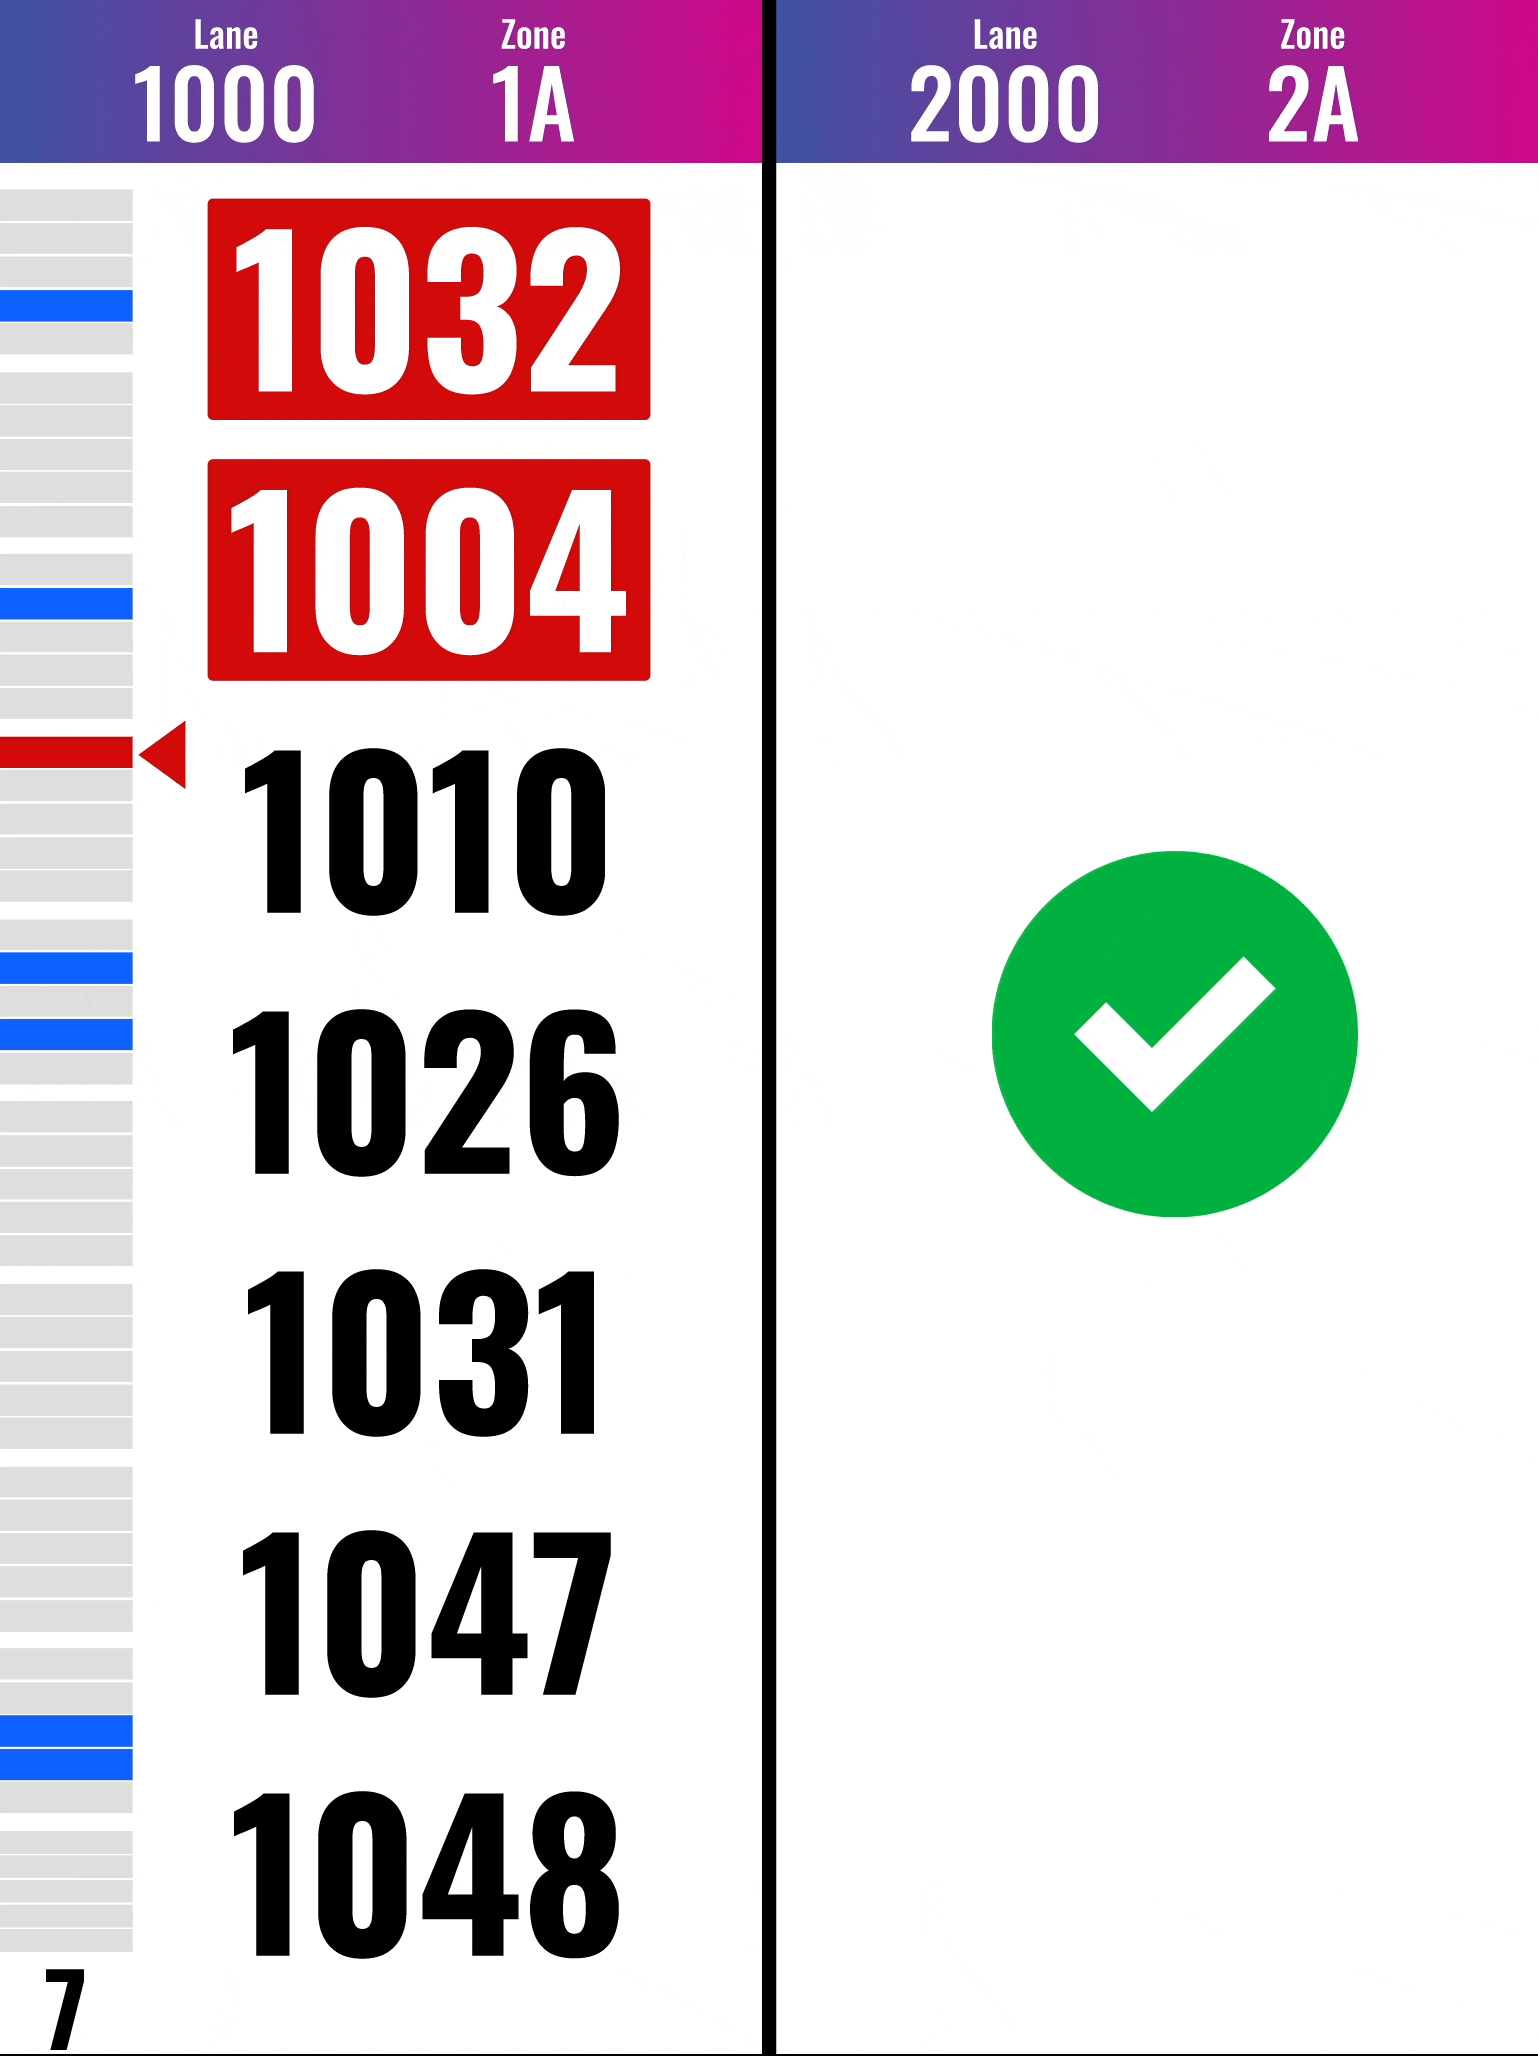
We continued to refine the design and built out the app after leaving the facility. One of the most important factors in the design was accessibility. Many types of users would be looking at these monitors, and often from very far away. Text had to be large, colors had to be high contrast, and each status needed a shape differentiation.
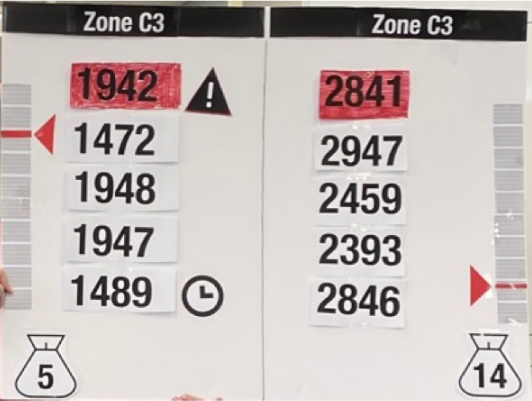
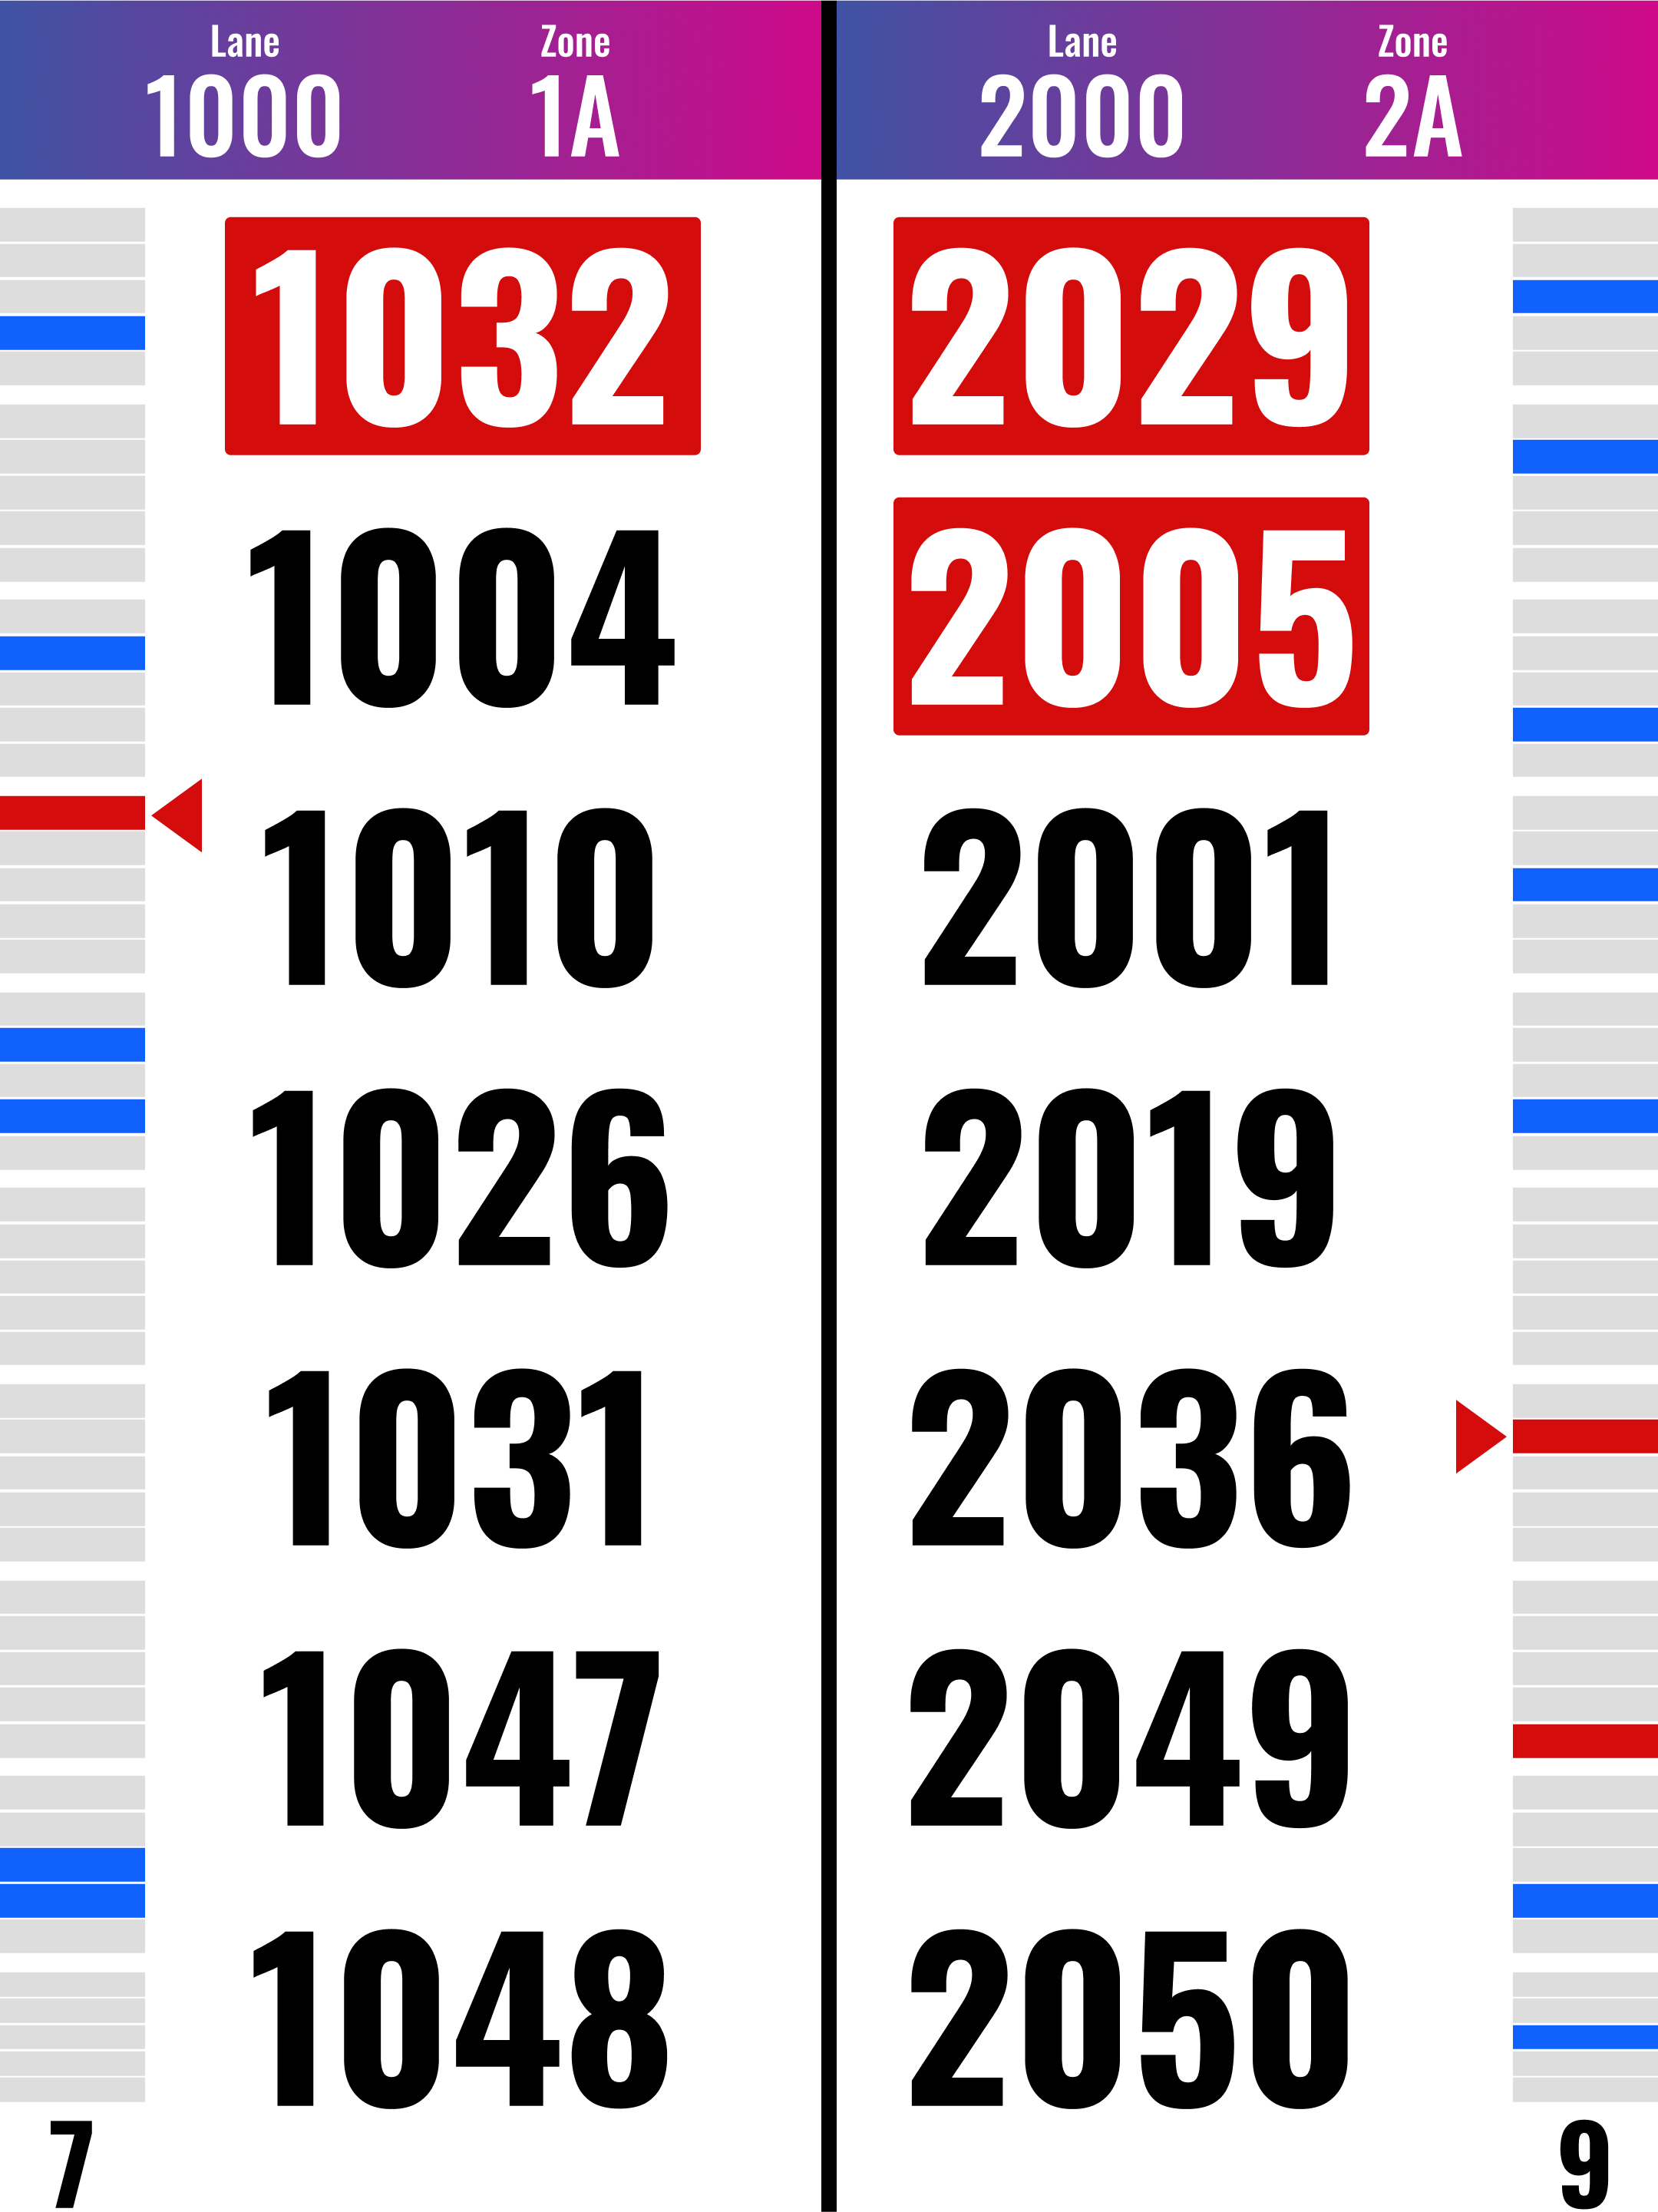
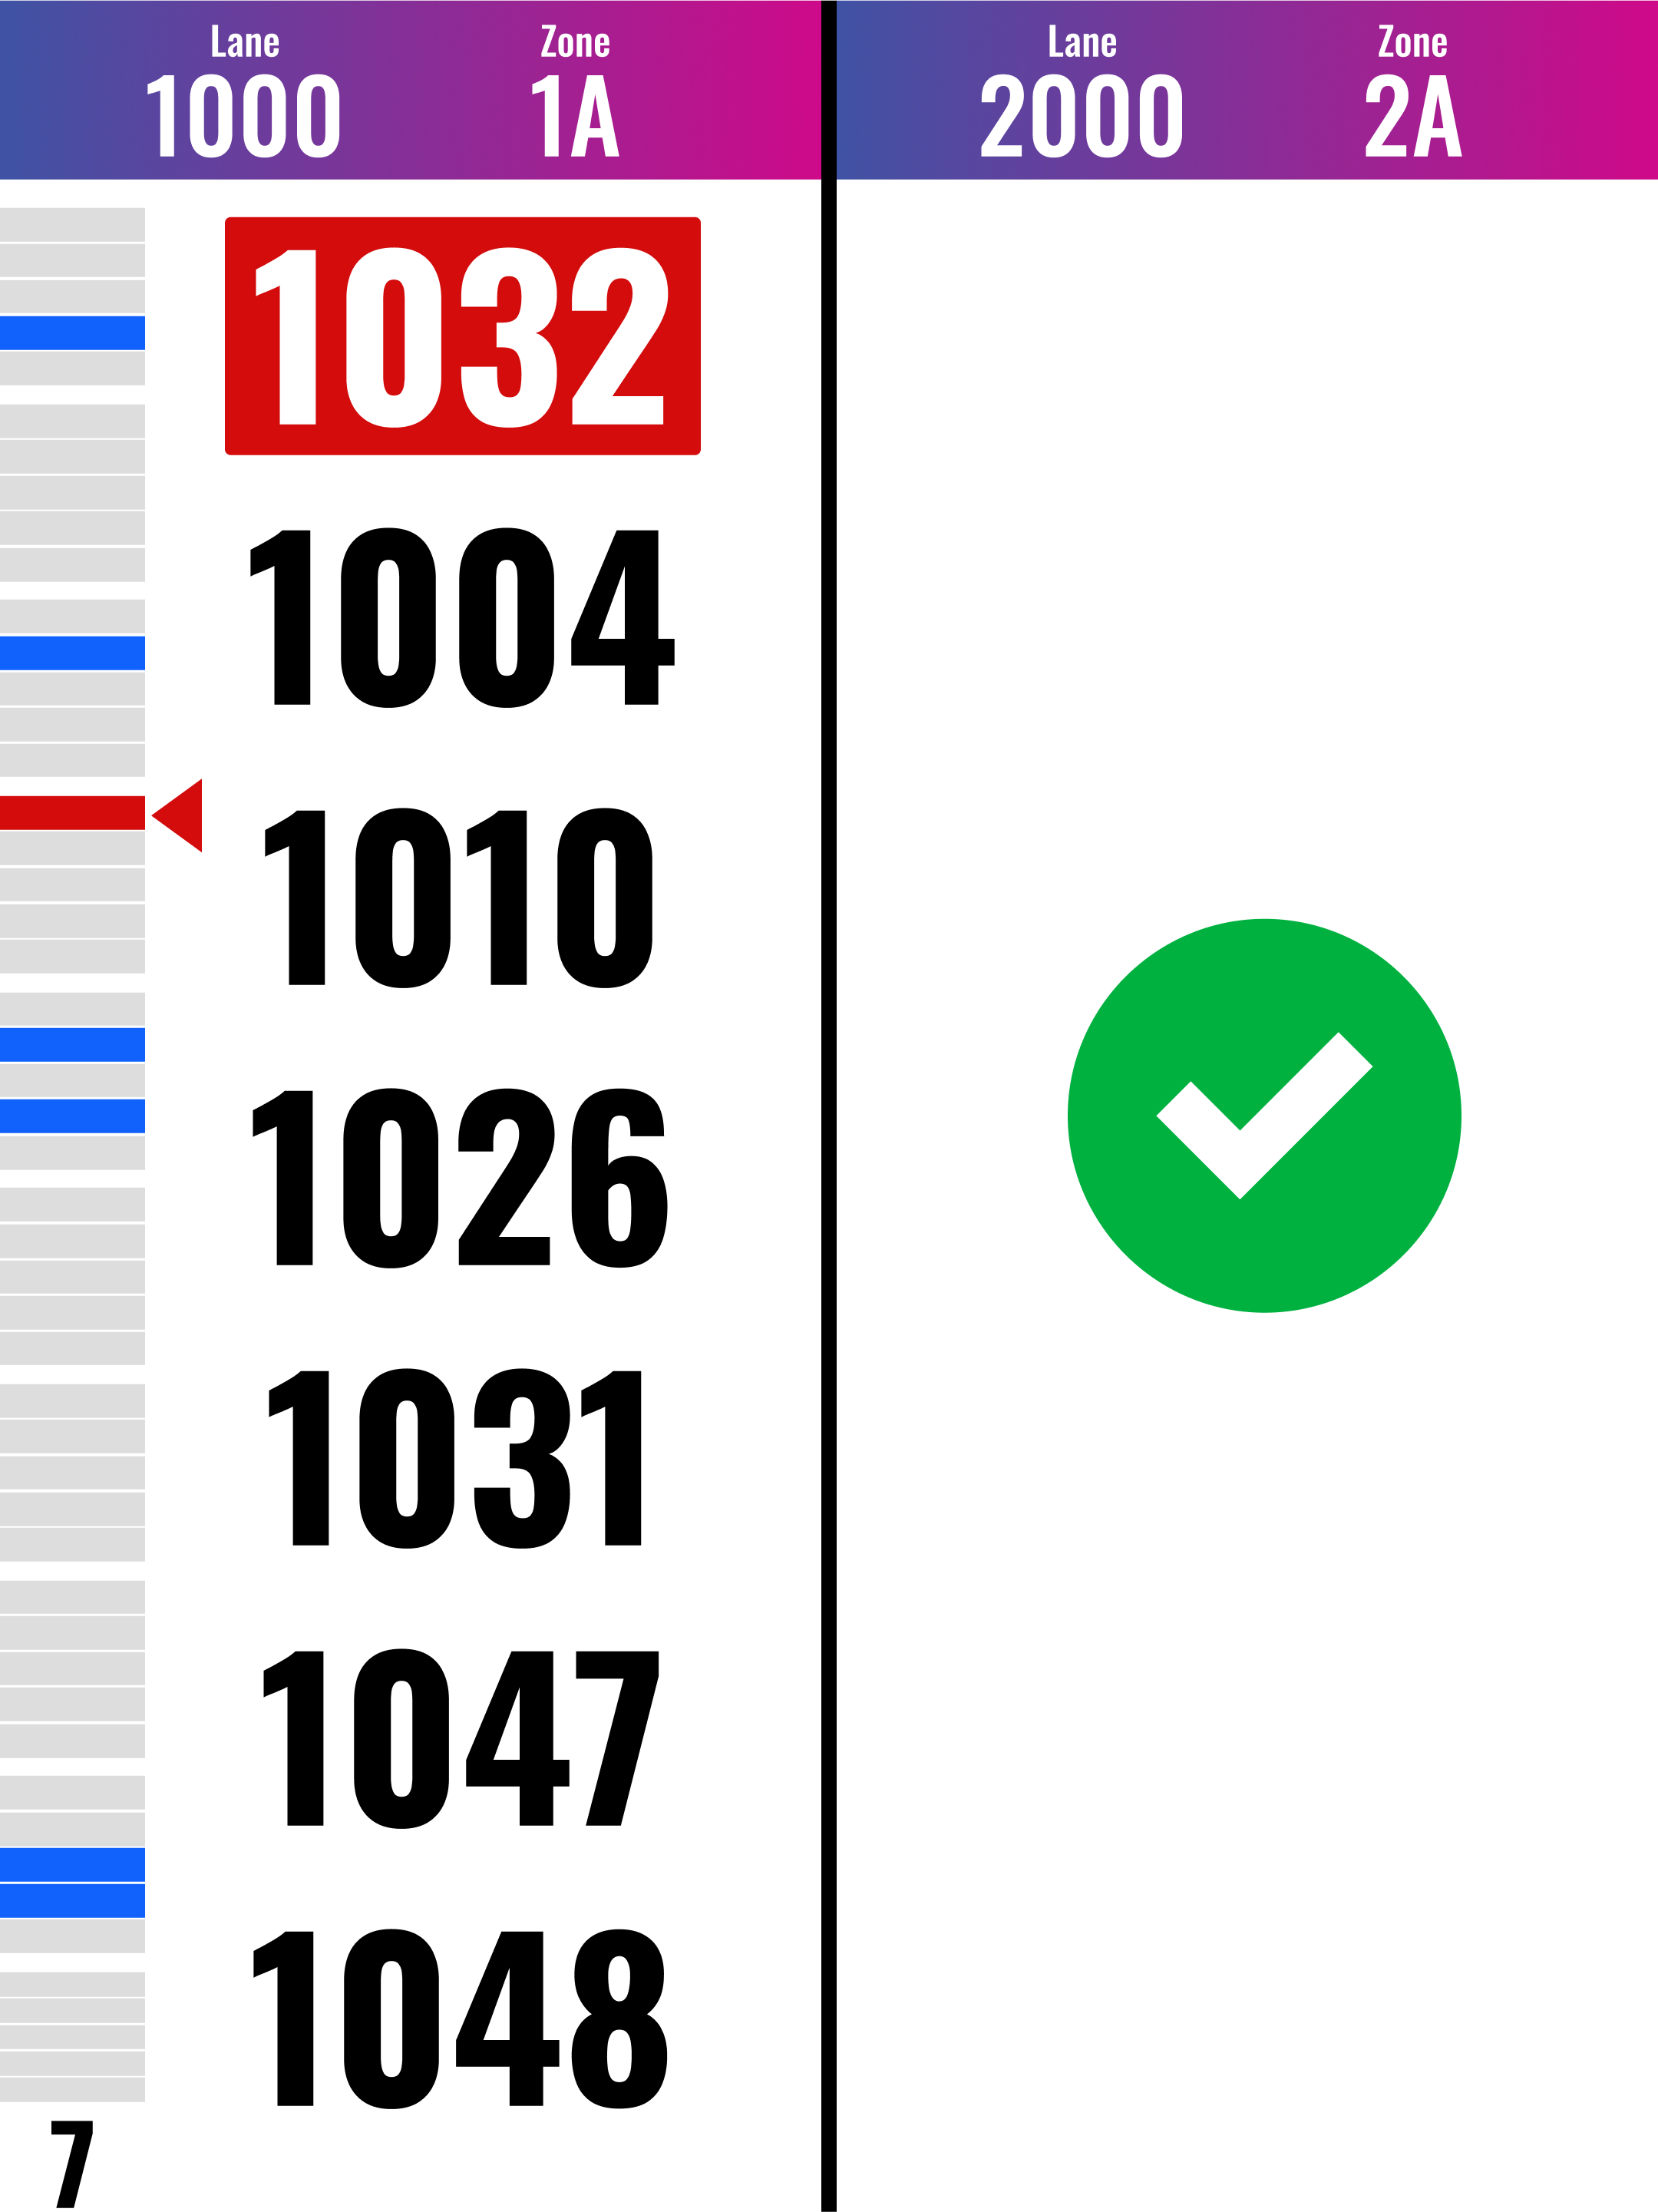
Statuses:
- Urgent: Flashes red and plays alert sound. Bins full longer than 15 min.
- High Priority: Solid red. Bin full longer than 8 min.
- Normal: Black text. Bin full less than 8 min.
- Success: Green checkmark shown when no bins are full.
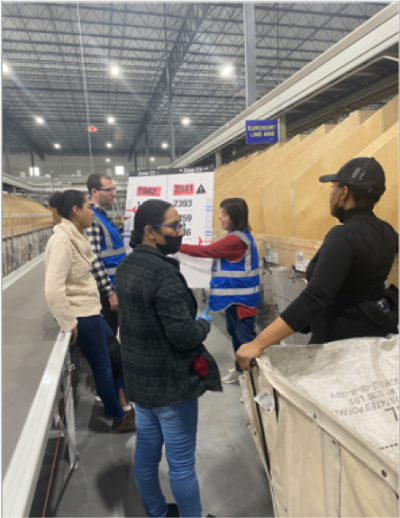
Step 8 - Pilot Testing & Results
The monitors were piloted in one facility for a month before rolling out to the rest of the network. To measure success the team tracked the average bin full time and observed a 50% reduction in the first week. The trend continued for the first month, and shortly after the monitors were rolled out to other facilities.